AI生成した3Dモデルのパイプライン④:一覧資料の作成
AI生成したモデルをゲームエンジンで利用できるようなパイプラインのプロトを作る。 プロトタイプということでコードはあまり整理していません。一例としてご覧ください。


前回の記事
AI生成した3Dモデルのパイプライン③:コンバートパイプラインのプロトタイプ
https://www.procedural.jp/articles/b2v9og0110q4
今回は前回記事の最後で端折ったディレクトリ以下の情報をスプレッドシートにまとめている下り。
資料化したい情報をjsonとして書き出す
Houdini上でPythonを追加し出力したいアトリビュートを追加したい。
ひとまず元メッシュのポリゴン数と変換後のメッシュを保存する想定でjsonを出力する。
元メッシュ読み込み後にwrangleを追加し、ポリゴン数をdetailアトリビュートに追加。
i@source_primnum = @numprim;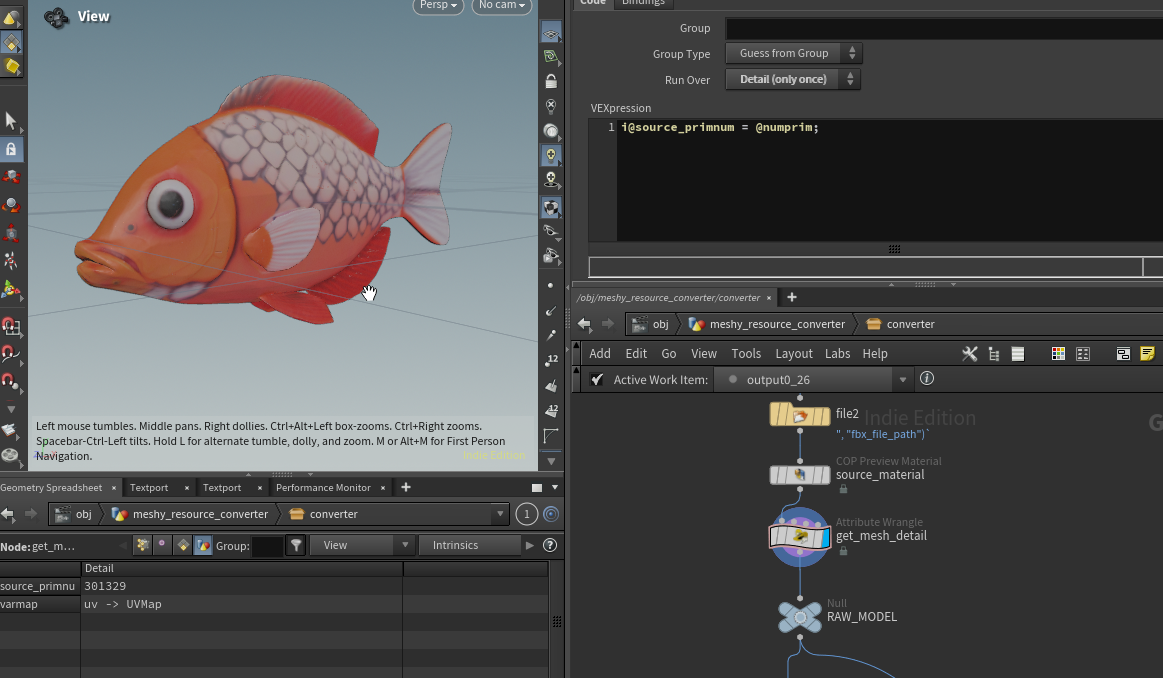
rop fbxの前にも同様にポリゴン数カウントを追加
i@fix_primnum = @numprim;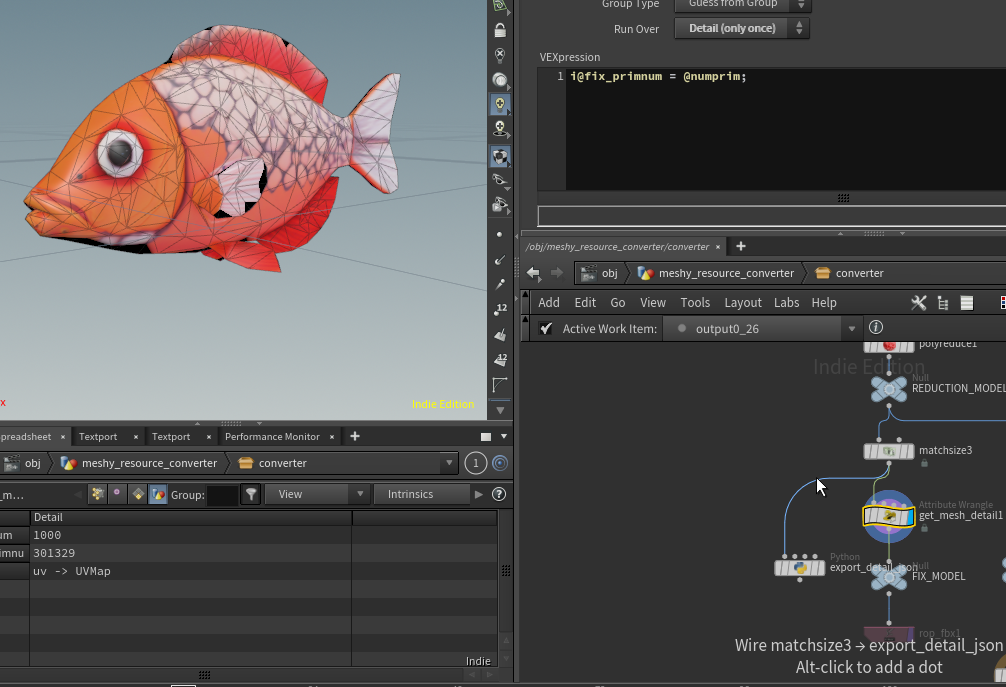
rop_fbxの前に Pythonノードを追加し、json出力用のコードを追加
import json

setting_node = hou.node("../SETTING")
setting_geo = setting_node.geometry()

source_model_node = hou.node("../RAW_MODEL")
source_model_geo = source_model_node.geometry()

fix_model_node = hou.node("../FIX_MODEL")
fix_model_geo = fix_model_node.geometry()

detail = {
    "source_primnum": source_model_geo.attribValue("source_primnum"),
    "fix_primnum": fix_model_geo.attribValue("fix_primnum")}

export_path = setting_geo.attribValue("export_detail_json_file_path")
with open(export_path, 'w') as f:
    json.dump(detail, f)
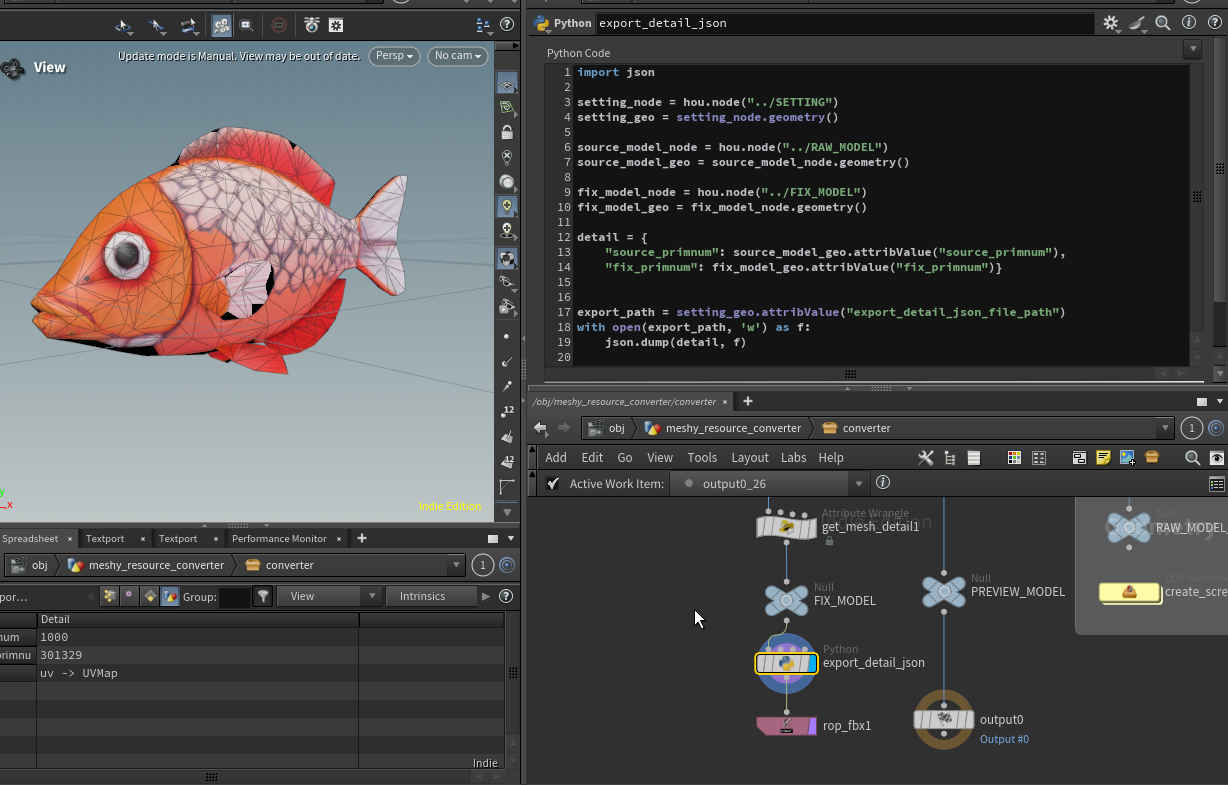
コンバート時にノード内の情報を出力するための準備ができた。
openpyxlで一覧資料を作成
環境にopenpyxlと画像を追加したいのでpillowを追加し、
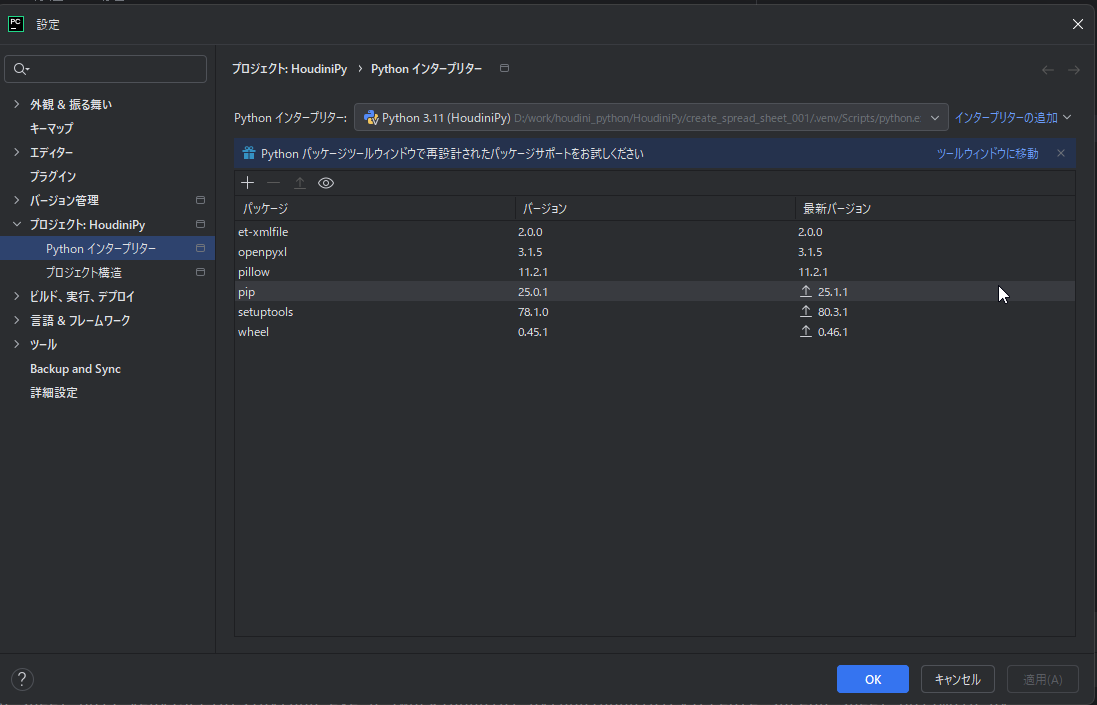
コードを実行(Houdiniの外で実行しています)
"""
作成した画像ファイルとjsonデータをまとめた表を作成する
"""
import os
import json

import openpyxl
from openpyxl import styles
from openpyxl.utils import get_column_letter
from openpyxl.drawing import image

def create_summary_sheet(root_directory_path: str):
    """画像ファイルとdetail.jsonをまとめたExcelシートを作成する

    Args:
        root_directory_path (str): ルートディレクトリのパス
    """
    workbook = openpyxl.Workbook()
    sheet = workbook.active

    # ヘッダー行の作成とスタイルの適用
    headers = ["名前", "生成モデル", "変換モデル", "生成モデルポリゴン数", "変換モデルポリゴン数"]
    sheet.append(headers)
    header_font = styles.Font(bold=True)
    header_fill = styles.PatternFill(start_color="AFCDAF", end_color="AFCDAF", fill_type="solid")
    for col_num, header in enumerate(headers, 1):
        cell = sheet.cell(row=1, column=col_num, value=header)
        cell.font = header_font
        cell.fill = header_fill

    # 罫線のスタイル定義
    thin_border = styles.Border(right=styles.Side(style="thin", color="000000"))
    thick_border = styles.Border(bottom=styles.Side(style="thick", color="000000"))

    # 0行目と1行目の間に太い線を引く (ヘッダー下)
    for col_num in range(1, len(headers) + 1):
        sheet.cell(row=1, column=col_num).border = thick_border

    # ヘッダーの固定
    sheet.freeze_panes = "A2"

    row_num = 2  # データ書き込み開始行

    # ルートフォルダ内の各ディレクトリを走査
    for model_dir_name in os.listdir(root_directory_path):
        model_dir_path = os.path.join(root_directory_path, model_dir_name)

        # モデルディレクトリであるか確認
        if os.path.isdir(model_dir_path):
            image_files = sorted([f for f in os.listdir(model_dir_path)
                                  if f.lower().endswith((".png", ".jpg", ".jpeg"))])
            detail_file = os.path.join(model_dir_path, "detail.json")
            detail_data = {}

            # 0列目の色調を変更
            first_col_cell = sheet.cell(row=row_num, column=1, value=model_dir_name)
            first_col_fill = styles.PatternFill(
                start_color="AFAFCD", end_color="AFAFCD", fill_type="solid") # Light Gray
            first_col_cell.fill = first_col_fill

            # 0列目と1列目の間に細い線を引く
            sheet.cell(row=row_num, column=1).border = thin_border

            # detail.json が存在する場合
            if os.path.exists(detail_file):
                with open(detail_file, "r", encoding="utf-8") as f:
                    try:
                        detail_data = json.load(f)
                    except Exception as e:
                        print(f"エラーが発生しました: {e}")
            elif os.path.exists(detail_file.replace(".json", ".JSON")):
                detail_file_upper = detail_file.replace(".json", ".JSON")
                with open(detail_file_upper, "r", encoding="utf-8") as f:
                    try:
                        detail_data = json.load(f)
                    except Exception as e:
                        print(f"エラーが発生しました: {e}")
            else:
                # detail.json が存在していない
                pass

            # 画像を最大2つまで同じ行に追加
            for i, image_filename in enumerate(image_files[:2]):
                image_path = os.path.join(model_dir_path, image_filename)
                col_num = 2 + i  # B列から配置

                try:
                    img = image.Image(image_path)
                    target_width = 120
                    target_height = 90
                    img.width = target_width
                    img.height = target_height
                    anchor_cell = get_column_letter(col_num) + str(row_num)
                    sheet.add_image(img, anchor_cell)
                    sheet.row_dimensions[row_num].height = target_height * 1.2
                    col_letter = get_column_letter(col_num)
                    sheet.column_dimensions[col_letter].width = target_width / 7.0
                except Exception as e:
                    print(f"エラーが発生しました: {e}")

            # detail.json の特定のキーの値を書き込み
            source_polygon_num = detail_data.get("source_primnum", "")
            converted_polygon_num = detail_data.get("fix_primnum", "")
            sheet.cell(row=row_num, column=4, value=source_polygon_num)
            sheet.cell(row=row_num, column=5, value=converted_polygon_num)

            row_num += 1

    # 列幅の自動調整 (モデルディレクトリ名と特定キーの列)
    sheet.column_dimensions["A"].auto_size = True
    sheet.column_dimensions["D"].auto_size = True
    sheet.column_dimensions["E"].auto_size = True

    # ワークブックを保存
    output_excel_file = os.path.join(root_directory_path, "image_detail_summary.xlsx")
    workbook.save(output_excel_file)

# 実行例
root = "D:/resource/meshyai/lib"
create_summary_sheet(root)
スプレッドシートが生成されました(自分の家の環境にはExcelが無いのでGoogleSpreadSheetで確認しています)
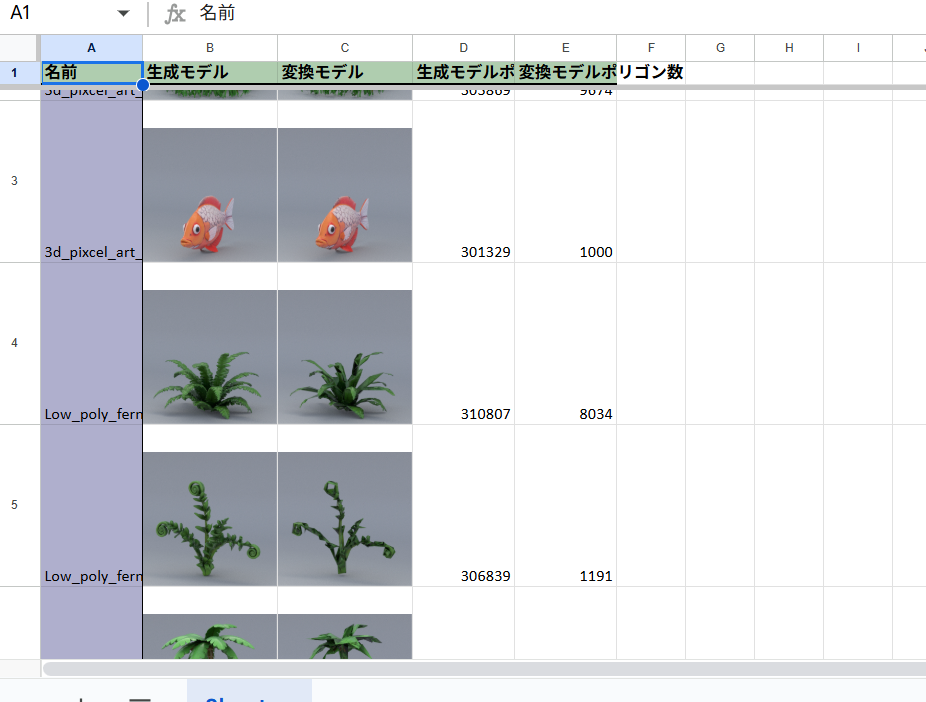
仕組みのベースのうち、スプレッドシート作成の部分についてです。
実パイプラインに落とし込んでいくにあたり、必要なアトリビュートなどの情報を追加します。

fish_ball
プロシージャル魚類